We support risk management professionals with credible real-time scoring, analytical platforms, and data feeds

The GenAI powered platform for civil unrest risk, kidnap and ransom risk and commodity risk
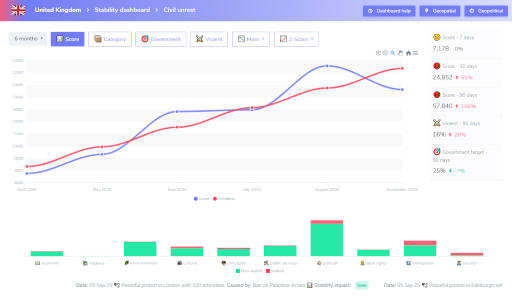
Credible, transparent and tailored risk scoring
100+ scores and Z-scores for regions, countries, sub-country and client defined geographic areas and risk concerns
Global and real-time
Updates hourly and supports 249 countries and territories. Events generated from 150,000 news sources in 13 languages
Unique geo-tagged event feed
Easily drill down to a scored 'wikipedia-like' event card for individual events with 30+ characteristics
Platform and API
For analysts: an intuitive platform with dynamic charts, query building, mapping, and personalised email alerts. For developers and partners: a customisable API.
GenAI powered data accuracy
Less than 5% false positives and less than 10% false negatives
From $950 per month
For 5 users with full platform and API access
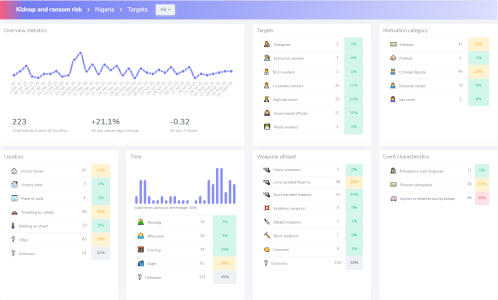
Instant insights for who, what, where, when and how
Enables you to instantly identify specific risks to specific target sets
Global and real-time
Updates hourly and supports 249 countries and territories. Events generated from 150,000 news sources in 13 languages
Unique geo-tagged event feed
Easily drill down to a scored 'wikipedia-like' event card for individual events with 30+ characteristics
Platform and API
For analysts: an intuitive platform with dynamic charts, query building, mapping, and personalised email alerts. For developers and partners: a customisable API.
GenAI powered data accuracy
Less than 5% false positives and less than 10% false negatives
From $950 per month
For 5 users with full platform and API access
Credible, transparent and tailored risk scoring
Scoring for how civil unrest impacts supply risk for 30+ commodities
Global and real-time
Updates hourly and collects from 249 countries and territories. Events generated from 150,000 news sources in 13 languages
New commodities on demand
Add new commodities within 30 days of becoming a client
Platform and API
For analysts: an intuitive platform with dynamic charts, query building, mapping, and personalised email alerts. For developers and partners: a customisable API.
GenAI powered data accuracy
Less than 5% false positives and less than 10% false negatives
From $950 per month
For 5 users with full platform and API access
